·
Use case Diagram
·
Sequence Diagram
·
Class Diagram
·
Database Diagram
What is a UML Use Case Diagram?
Use case diagrams model the functionality of a system using actors and use cases. Use cases are services or functions provided by the system to its users.YouTube https://www.youtube.com/channel/UCJojbxGV0sfU1QPWhRxx4-A
LinkedIn https://www.linkedin.com/in/ict-bit-tuition-class-software-development-colombo/
WordPress https://computerclassinsrilanka.wordpress.com
quora https://www.quora.com/profile/BIT-UCSC-UoM-Final-Year-Student-Project-Guide
Newsletter https://sites.google.com/view/the-leaning-tree/newsletter
Wix https://itclasssl.wixsite.com/icttraining
Web https://itclass-bit-ucsc-uom-php-final-project.business.site/
mystrikingly https://bit-ucsc-uom-final-year-project-ideas-help-guide-php-class.mystrikingly.com/
https://elakiri.com/threads/bit-ucsc-uom-php-mysql-project-guidance-and-individual-classes-in-colombo.1627048/
ucsc bit registration 2023 bit (ucsc syllabus) bit colombo university fees bit results bit vle bit course fee bit exam time table 2023 bit moratuwa
Basic Use Case Diagram Symbols and Notations
System
Draw your system's boundaries using a rectangle that contains use cases. Place actors outside the system's boundaries.
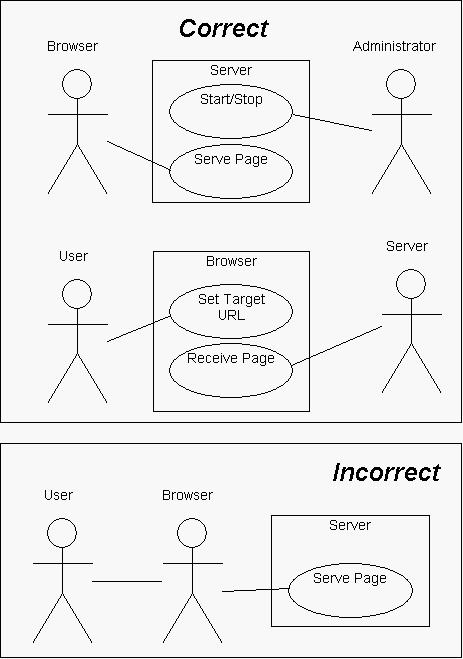
Use Case
Draw use cases using ovals. Label with ovals with verbs that represent the system's functions.

Actors
Actors are the users of a system. When one system is the actor of another system, label the actor system with the actor stereotype.

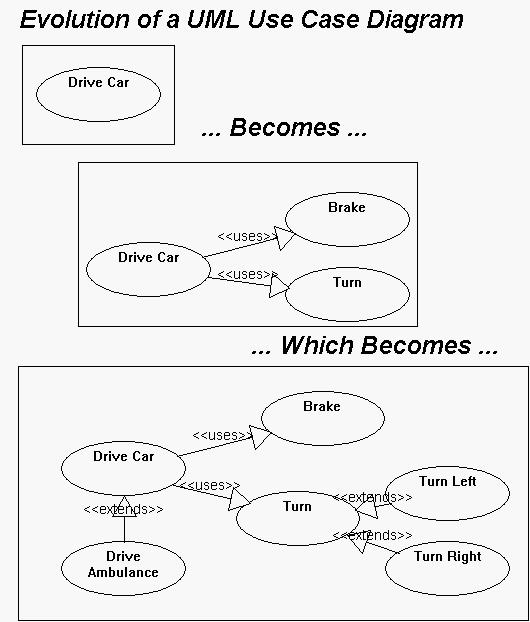
Relationships
Illustrate relationships between an actor and a use case with a simple line. For relationships among use cases, use arrows labeled either "uses" or "extends." A "uses" relationship indicates that one use case is needed by another in order to perform a task. An "extends" relationship indicates alternative options under a certain use case.
Learn how to draw relationships.

Learn how to draw relationships.
https://www.andrew.cmu.edu/course/90-754/umlucdfaq.html
With the help of a use
case diagram, you can discuss and communicate:
- The scenarios in which your system or application
interacts with people, organizations, or external systems.
- The goals that it helps those actors achieve.
- The scope of your system.
A use case diagram
does not show the detail of the use cases: it only summarizes some of the
relationships between use cases, actors, and systems. In particular, the
diagram does not show the order in which steps are performed to achieve the
goals of each use case. You can describe those details in other diagrams and
documents, which you can link to each use case. For more information, see Describing Use
Cases in Detail in this topic.
- An actor (1) is a class of person,
organization, device, or external software component that interacts with
your system. Example actors are Customer, Restaurant,Temperature Sensor, Credit Card Authorizer.
- A use case (2) represents the actions
that are performed by one or more actors in the pursuit of a particular
goal. Example use cases are Order
Meal, Update Menu,Process Payment.

On a use case diagram, use cases are
associated (3) with the actors that perform them.
- Your system (4) is whatever you are
developing. It might be a small software component, whose actors are just
other software components; or it might be a complete application; or it
might be a large distributed suite of applications deployed over many
computers and devices. Example subsystems are Meal Ordering Website, Meal Delivery Business, Website Version 2.
A use case diagram can show which use cases
are supported by your system or its subsystems.
Drawing Actors and Use Cases
The
main purpose of a use case diagram is to show who interacts with your system,
and the main goals they achieve with it.
Structuring Use Cases
You
should try to describe your system's behavior with just a few major use cases.
Each large use case defines a major goal that an actor achieves, such as buying
a product, or, from the vendor's point of view, providing products for sale.
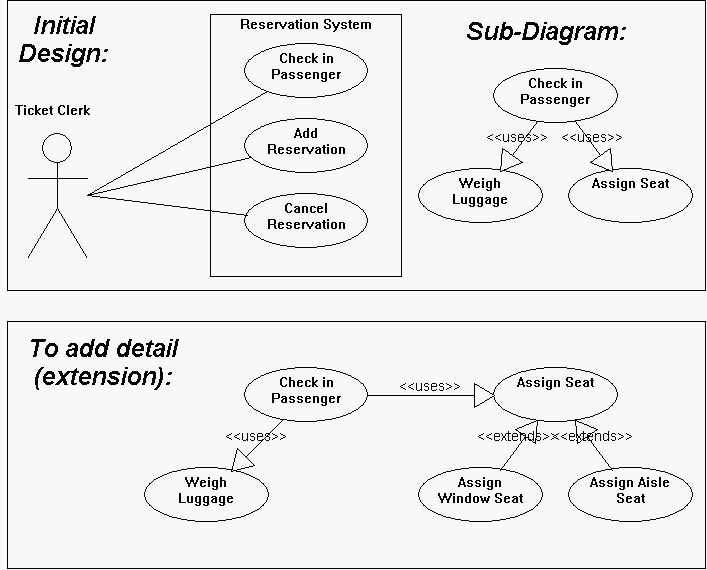
Use
an Include relation to show that one use case
describes some of the detail of another. In the illustration, Order a Meal includes Pay, Choose Menu, and Choose Menu Item. Each of the
included, more detailed use cases is a step that the actor or actors might have
to perform to achieve the overall goal of the including use case. The arrow
should point at the more detailed, included use case.

The
goal and scenarios of an included use case should make sense independently so
that it can be included in use cases that are designed later.
Sharing goals with Generalization
Use a
Generalization relation to show that a specialized use
case is a particular way to achieve the goals expressed by another general use case. The open arrowhead should
point at the more general use case.

For
example, Pay generalizes Pay by Credit Card and Pay by Cash.
Separating variant cases with Extend
Use
an Extend link to show that one use case may add functionality to another use
case under certain circumstances. The arrow should point at the main, extended
use case.


You
can use different subsystem boundaries to illustrate different versions of the
system. For example, the Pay use case might be included in Website Version 2
but not in Version 1.This implies that the system helps customers make their
orders. However, they have to pay the restaurant directly.

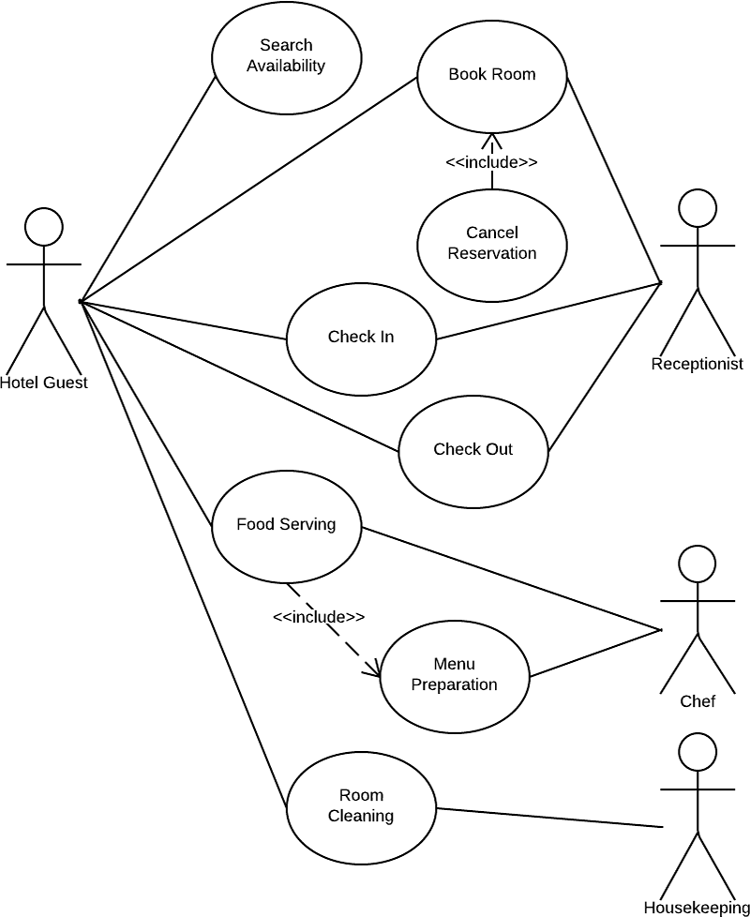
Basic Use case Diagram For Hotel Management System
Basic Use case Diagram For Hotel Management System


What is a UML Sequence Diagram?
Sequence diagrams describe interactions among classes in terms of
an exchange of messages over time.
Basic Sequence Diagram Symbols and Notations
What is a UML Sequence Diagram?
Basic Sequence Diagram Symbols and Notations
Class roles
Class roles describe the way an object will behave in context. Use the UML object symbol to illustrate class roles, but don't list object attributes.
Learn how to edit text on a symbol.

Class roles describe the way an object will behave in context. Use the UML object symbol to illustrate class roles, but don't list object attributes.
Learn how to edit text on a symbol.
Learn how to edit text on a symbol.
Activation
Activation boxes represent the time an object needs to complete a task.

Activation boxes represent the time an object needs to complete a task.
Messages
Messages are arrows that represent communication between objects. Use half-arrowed lines to represent asynchronous messages. Asynchronous messages are sent from an object that will not wait for a response from the receiver before continuing its tasks.
Learn how to draw messages.


Various message types for Sequence and Collaboration diagrams
Messages are arrows that represent communication between objects. Use half-arrowed lines to represent asynchronous messages. Asynchronous messages are sent from an object that will not wait for a response from the receiver before continuing its tasks.
Learn how to draw messages.
Learn how to draw messages.
Various message types for Sequence and Collaboration diagrams
Lifelines
Lifelines are vertical dashed lines that indicate the object's presence over time.
Learn how to attach activation boxes to lifelines.

Lifelines are vertical dashed lines that indicate the object's presence over time.
Learn how to attach activation boxes to lifelines.
Learn how to attach activation boxes to lifelines.
Destroying Objects
Objects can be terminated early using an arrow labeled "<< destroy >>" that points to an X.

Objects can be terminated early using an arrow labeled "<< destroy >>" that points to an X.
Loops
A repetition or loop within a sequence diagram is depicted as a rectangle. Place the condition for exiting the loop at the bottom left corner in square brackets [ ].
Learn how to arrange objects on a page.

A repetition or loop within a sequence diagram is depicted as a rectangle. Place the condition for exiting the loop at the bottom left corner in square brackets [ ].
Learn how to arrange objects on a page.
Learn how to arrange objects on a page.
The diagram below shows how objects interact in
the "rent item" collaboration when the item is not available during
the requested period.

Objects as well as classes can be
targets on a sequence diagram, which means that messages can be sent to them. A
target is displayed as a rectangle with some text in it. Below the target, its
lifeline extends for as long as the target exists. The lifeline is displayed as
a vertical dashed line.
Object
The basic
notation for an object is
 As with
any UML-element, you can add a stereotype to a target. Some often used
stereotypes for objects are «actor», «boundary», «control», «entity» and
«database». They can be displayed with icons as well :
As with
any UML-element, you can add a stereotype to a target. Some often used
stereotypes for objects are «actor», «boundary», «control», «entity» and
«database». They can be displayed with icons as well :
MultiObject
When you
want to show how a client interacts with the elements of a collection, you can
use a multiobject. Its basic notation is
Class
The basic
notation for a class is This corresponds to an
iteration over the elements in the collection, where each element receives the
message. For each element, the condition is evaluated before the message is
sent. Usually though, the condition is used as a filter that selects elements
from the collection (e.g. 'all', 'adults', 'new customers' as filters for a collection
of Person objects). Only elements selected by the filter will receive the
message.
This corresponds to an
iteration over the elements in the collection, where each element receives the
message. For each element, the condition is evaluated before the message is
sent. Usually though, the condition is used as a filter that selects elements
from the collection (e.g. 'all', 'adults', 'new customers' as filters for a collection
of Person objects). Only elements selected by the filter will receive the
message. Several things are worth
noting in this example
Several things are worth
noting in this example
What is a UML Class Diagram?
What is a UML Class Diagram?
Basic Class Diagram Symbols and Notations
Classes represent an abstraction of entities with common characteristics. Associations represent the relationships between classes.
Illustrate classes with rectangles divided into compartments. Place the name of the class in the first partition (centered, bolded, and capitalized), list the attributes in the second partition, and write operations into the third.
Learn how to create this symbol.
Learn how to create this symbol.
Active Class
Active classes initiate and control the flow of activity, while passive classes store data and serve other classes. Illustrate active classes with a thicker border.

Active classes initiate and control the flow of activity, while passive classes store data and serve other classes. Illustrate active classes with a thicker border.
Visibility
Use visibility markers to signify who can access the information contained within a class. Private visibility hides information from anything outside the class partition. Public visibility allows all other classes to view the marked information. Protected visibility allows child classes to access information they inherited from a parent class. Learn how to edit text.

Use visibility markers to signify who can access the information contained within a class. Private visibility hides information from anything outside the class partition. Public visibility allows all other classes to view the marked information. Protected visibility allows child classes to access information they inherited from a parent class. Learn how to edit text.
Associations
Associations represent static relationships between classes. Place association names above, on, or below the association line. Use a filled arrow to indicate the direction of the relationship. Place roles near the end of an association. Roles represent the way the two classes see each other.
Note: It's uncommon to name both the association and the class roles.
Learn how to edit text.
Note: It's uncommon to name both the association and the class roles.
Learn how to edit text.
Multiplicity (Cardinality)
Place multiplicity notations near the ends of an association. These symbols indicate the number of instances of one class linked to one instance of the other class. For example, one company will have one or more employees, but each employee works for one company only.

Place multiplicity notations near the ends of an association. These symbols indicate the number of instances of one class linked to one instance of the other class. For example, one company will have one or more employees, but each employee works for one company only.
Constraint
Place constraints inside curly braces {}.
 Simple Constraint
Place constraints inside curly braces {}.
Simple ConstraintComposition and Aggregation
Composition is a special type of aggregation that denotes a strong ownership between Class A, the whole, and Class B, its part. Illustrate composition with a filled diamond. Use a hollow diamond to represent a simple aggregation relationship, in which the "whole" class plays a more important role than the "part" class, but the two classes are not dependent on each other. The diamond end in both a composition and aggregation relationship points toward the "whole" class or the aggregate.

Composition is a special type of aggregation that denotes a strong ownership between Class A, the whole, and Class B, its part. Illustrate composition with a filled diamond. Use a hollow diamond to represent a simple aggregation relationship, in which the "whole" class plays a more important role than the "part" class, but the two classes are not dependent on each other. The diamond end in both a composition and aggregation relationship points toward the "whole" class or the aggregate.
Generalization
Generalization is another name for inheritance or an "is a" relationship. It refers to a relationship between two classes where one class is a specialized version of another. For example, Honda is a type of car. So the class Honda would have a generalization relationship with the class car.

In real life coding examples, the difference between inheritance and aggregation can be confusing. If you have an aggregation relationship, the aggregate (the whole) can access only the PUBLIC functions of the part class. On the other hand, inheritance allows the inheriting class to access both the PUBLIC and PROTECTED functions of the superclass.
In real life coding
examples, the difference between inheritance and aggregation can be confusing.
If you have an aggregation relationship, the aggregate (the whole) can access
only the PUBLIC functions of the part class. On the other hand, inheritance
allows the inheriting class to access both the PUBLIC and PROTECTED functions
of the superclass.
Learn how to draw a
generalization relationship.
Generalization is another name for inheritance or an "is a" relationship. It refers to a relationship between two classes where one class is a specialized version of another. For example, Honda is a type of car. So the class Honda would have a generalization relationship with the class car.
In real life coding examples, the difference between inheritance and aggregation can be confusing. If you have an aggregation relationship, the aggregate (the whole) can access only the PUBLIC functions of the part class. On the other hand, inheritance allows the inheriting class to access both the PUBLIC and PROTECTED functions of the superclass.
Learn how to draw a generalization relationship.
UML Class Diagram Relationships, Aggregation, Composition
There are five key relationships between classes in a UML class diagram : dependency, aggregation, composition, inheritance and realization. These five relationships are depicted in the following diagram:
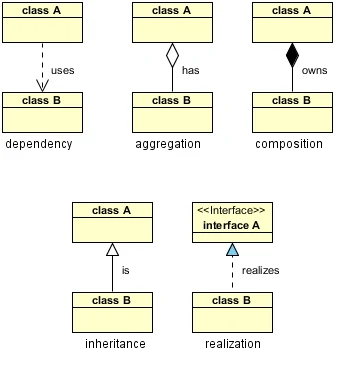
UML Class Relationships
The above relationships are read as follows:
- Dependency : class A uses class B
- Aggregation : class A has a class B
- Composition : class A owns a class B
- Inheritance : class B is a Class A (or class A is extended by class B)
- Realization : class B realizes Class A (or class A is realized by class B)
What I hope to show here is how these relationships would manifest themselves in Java so we can better understand what these relationships mean and how/when to use each one.
Dependency is represented when a reference to one class is passed in as a method parameter to another class. For example, an instance of class B is passed in to a method of class A:
1
2
3
public class A {
public void doSomething(B b) {
Now, if class A stored the reference to class B for later use we would have a different relationship called Aggregation. A more common and more obvious example of Aggregation would be via setter injection:
1
2
3
4
5
public class A {
private B _b;
public void setB(B b) { _b = b; }
Aggregation is the weaker form of object containment (one object contains other objects). The stronger form is calledComposition. In Composition the containing object is responsible for the creation and life cycle of the contained object (either directly or indirectly). Following are a few examples of Composition. First, via member initialization:
1
2
3
public class A {
private B _b = new B();
Second, via constructor initialization:
1
2
3
4
5
6
7
public class A {
private B _b;
public A() {
_b = new B();
} // default constructor
Third, via lazy init (example revised 02 Mar 2014 to completely hide reference to B):
1
2
3
4
5
6
7
8
9
10
public class A {
private B _b;
public void doSomethingUniqueToB() {
if (null == _b) {
_b = new B();
}
return _b.doSomething();
} // doSomethingUniqueToB()
Inheritance is a fairly straightforward relationship to depict in Java:
1
2
3
4
5
6
7
8
9
10
11
public class A {
...
} // class A
public class B extends A {
....
} // class B
Realization is also straighforward in Java and deals with implementing an interface:
1
2
3
4
5
6
7
8
9
10
11
public interface A {
...
} // interface A
public class B implements A {
...
} // class B
Ref http://usna86-techbits.blogspot.com/2012/11/uml-class-diagram-relationships.html
Library Management system Sequence diagram

There are five key relationships between classes in a UML class diagram : dependency, aggregation, composition, inheritance and realization. These five relationships are depicted in the following diagram:
The above relationships are read as follows:
Now, if class A stored the reference to class B for later use we would have a different relationship called Aggregation. A more common and more obvious example of Aggregation would be via setter injection:
Aggregation is the weaker form of object containment (one object contains other objects). The stronger form is calledComposition. In Composition the containing object is responsible for the creation and life cycle of the contained object (either directly or indirectly). Following are a few examples of Composition. First, via member initialization:
Second, via constructor initialization:
Third, via lazy init (example revised 02 Mar 2014 to completely hide reference to B):
Realization is also straighforward in Java and deals with implementing an interface:
 |
| UML Class Relationships |
- Dependency : class A uses class B
- Aggregation : class A has a class B
- Composition : class A owns a class B
- Inheritance : class B is a Class A (or class A is extended by class B)
- Realization : class B realizes Class A (or class A is realized by class B)
Dependency is represented when a reference to one class is passed in as a method parameter to another class. For example, an instance of class B is passed in to a method of class A:
1
2
3
| public class A { public void doSomething(B b) { |
Now, if class A stored the reference to class B for later use we would have a different relationship called Aggregation. A more common and more obvious example of Aggregation would be via setter injection:
1
2
3
4
5
| public class A { private B _b; public void setB(B b) { _b = b; } |
Aggregation is the weaker form of object containment (one object contains other objects). The stronger form is calledComposition. In Composition the containing object is responsible for the creation and life cycle of the contained object (either directly or indirectly). Following are a few examples of Composition. First, via member initialization:
1
2
3
| public class A { private B _b = new B(); |
Second, via constructor initialization:
1
2
3
4
5
6
7
| public class A { private B _b; public A() { _b = new B(); } // default constructor |
Third, via lazy init (example revised 02 Mar 2014 to completely hide reference to B):
1
2
3
4
5
6
7
8
9
10
| public class A { private B _b; public void doSomethingUniqueToB() { if (null == _b) { _b = new B(); } return _b.doSomething(); } // doSomethingUniqueToB() |
Inheritance is a fairly straightforward relationship to depict in Java:
1
2
3
4
5
6
7
8
9
10
11
| public class A { ...} // class Apublic class B extends A { ....} // class B |
Realization is also straighforward in Java and deals with implementing an interface:
1
2
3
4
5
6
7
8
9
10
11
| public interface A { ...} // interface Apublic class B implements A { ...} // class BRef http://usna86-techbits.blogspot.com/2012/11/uml-class-diagram-relationships.html |
Library Management system Sequence diagram
Online Shopping cart Sequence diagram

What is a Database Diagram?
Entity Relationship Diagram Symbols and Meaning
ERD Symbols |
|||
|
ConceptDraw PRO Discover the World of Visual Communication©
Design
elements Crow’s Foot notation
ConceptDraw gives the
ability to describe visually a database using the Crow’s Foot notation icons for drawing ER diagrams - ERD.
Entity-Relationship
model making possibility to describe a database in which in the
tables data can be the point to data in other tables - for instance, your
entry in the database could point to several entries.
The
symbols below are used at the most granular level of ERDs: physical data
models, although some elements are also used for logical data models.
Tables are
another way of representing entities.
Fields represent
attributes of the entity.
Keys are
one way to categorize attributes. A primary key is an attribute or
combination of attributes that uniquely identifies one and only one instance
of an entity. The primary key becomes a foreign key in any entity type to
which it's related through a one-to-one or one-to-many relationship.
Types may
refer to the type of data associated with the corresponding field in a table.
Types can also refer to entity types, which describe the structure of an
entity; e.g., a book's entity types are author, title, and published date.
| |||
Visual Database diagram Creation with MySQL Workbench


